| Continent | 1+ logged QSOs | 2+ logged QSOs | 6+ logged QSOs |
|---|---|---|---|
| Europe | 269,000 | 132,000 | 77,500 |
| North America | 157,000 | 82,000 | 46,000 |
| Asia | 73,000 | 33,000 | 18,000 |
| South America | 17,300 | 7,800 | 4,000 |
| Oceania | 13,400 | 6,400 | 3,500 |
| Africa | 7,800 | 3,400 | 1,800 |
| Antarctica | 151* | 63 | 37 |
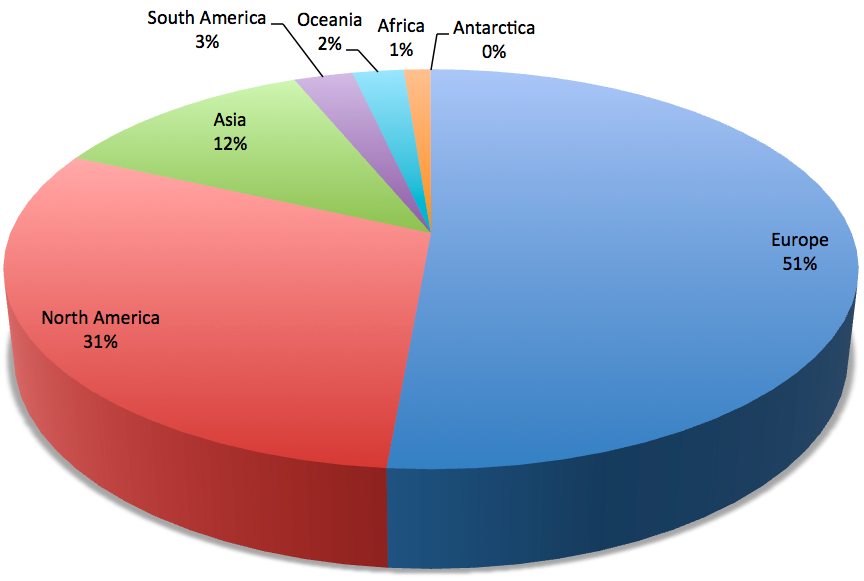
The sample size is 24 million QSOs. Counting just unique callsigns appears to me to strongly emphasize problem QSOs. That’s a trend which should be expected to get worse with a bigger sample, since that would mean there will be more unique errors in the data. For example, if the size of the sample doubled to 48 million QSOs then the 1+ QSOs column would inflate a lot, and the others would increase too. It’s probably best to focus on the 6+ column, above. That means that likely over 50 people have the call in their log worldwide; small enough to catch very short operations but large enough to avoid one-off mistakes.

The countries are grouped by continent as per normal ARRL conventions (followed strictly by Club Log). Allow for special events, contest calls, temporary callsigns, as well as logging errors. It’s striking that individual logging errors must be a substantial source of uniques in the average log. Is there another explanation for the difference between 151 and 37 Antarctic stations when we require not one, but 6+ references to the call? In the context of 24 million QSOs, noise is significant. I suppose that some callsigns will get busted more than others, too – and the more prefixes there are in a continent, perhaps the more error-prone that continent becomes?
Here are the top 30 DXCC entities by population (using the 6+ QSOs filter and again working from 1 January 2012 to the present day, April 2013):
| USA | 40809 |
| JAPAN | 11340 |
| FEDERAL REPUBLIC OF GERMANY | 11010 |
| EUROPEAN RUSSIA | 8216 |
| ITALY | 8074 |
| ENGLAND (many special calls in use in 2012) | 7750 |
| SPAIN | 4822 |
| UKRAINE | 4665 |
| FRANCE | 4029 |
| POLAND | 3903 |
| CANADA | 2974 |
| ASIATIC RUSSIA | 2628 |
| NETHERLANDS | 2354 |
| CZECH REPUBLIC | 1897 |
| SWEDEN | 1798 |
| BRAZIL | 1682 |
| BELGIUM | 1605 |
| AUSTRALIA | 1545 |
| ROMANIA | 1235 |
| FINLAND | 1228 |
| AUSTRIA | 1157 |
| SWITZERLAND | 1034 |
| HUNGARY | 1013 |
| ARGENTINA | 945 |
| SCOTLAND (many special calls in use in 2012) | 887 |
| CHINA | 854 |
| DENMARK | 842 |
| NORWAY | 808 |
| CROATIA | 801 |
| GREECE | 756 |
A further analysis which I have performed is to check whether continental populations are changing in proportion over time. Are any continents showing an increase relative to others? Since 2000, it seems probably not. Here is the data (“Unique callsigns by continent, as found in Club Log data from 2000 to 2013 where unique means a distinct callsign appearing not less than 3 times”).
| Year | AN | AS | EU | NA | OC | SA |
| 2000 | 0.0% | 13.0% | 45.7% | 34.4% | 2.5% | 3.0% |
| 2001 | 0.0% | 12.8% | 46.1% | 35.0% | 2.1% | 2.7% |
| 2002 | 0.0% | 12.6% | 46.7% | 34.5% | 2.1% | 2.9% |
| 2003 | 0.0% | 12.0% | 51.2% | 30.8% | 1.9% | 2.9% |
| 2004 | 0.0% | 12.1% | 51.4% | 30.5% | 2.0% | 2.7% |
| 2005 | 0.0% | 11.5% | 53.5% | 29.2% | 1.9% | 2.5% |
| 2006 | 0.0% | 10.8% | 54.3% | 29.2% | 2.0% | 2.3% |
| 2007 | 0.0% | 11.0% | 53.0% | 30.4% | 2.1% | 2.3% |
| 2008 | 0.0% | 11.0% | 52.9% | 30.2% | 2.2% | 2.4% |
| 2009 | 0.0% | 11.3% | 50.9% | 31.7% | 2.2% | 2.6% |
| 2010 | 0.0% | 11.8% | 50.9% | 31.0% | 2.3% | 2.8% |
| 2011 | 0.0% | 12.4% | 48.7% | 32.6% | 2.3% | 2.8% |
| 2012 | 0.0% | 12.1% | 50.7% | 30.8% | 2.3% | 2.8% |
| 2013 | 0.0% | 11.5% | 52.0% | 30.9% | 2.0% | 2.4% |
(Apologies for the absence of AF in the data above – this was unintentionally missed off by G7VJR when copying the data into HTML – I will add this data back shortly).

